Data Visualization and Digital Marketing Techniques That Will Take Your Business to the Next Level
Are you looking for ways to take your business to the next level? If so, you should consider investing in data visualization and digital marketing.
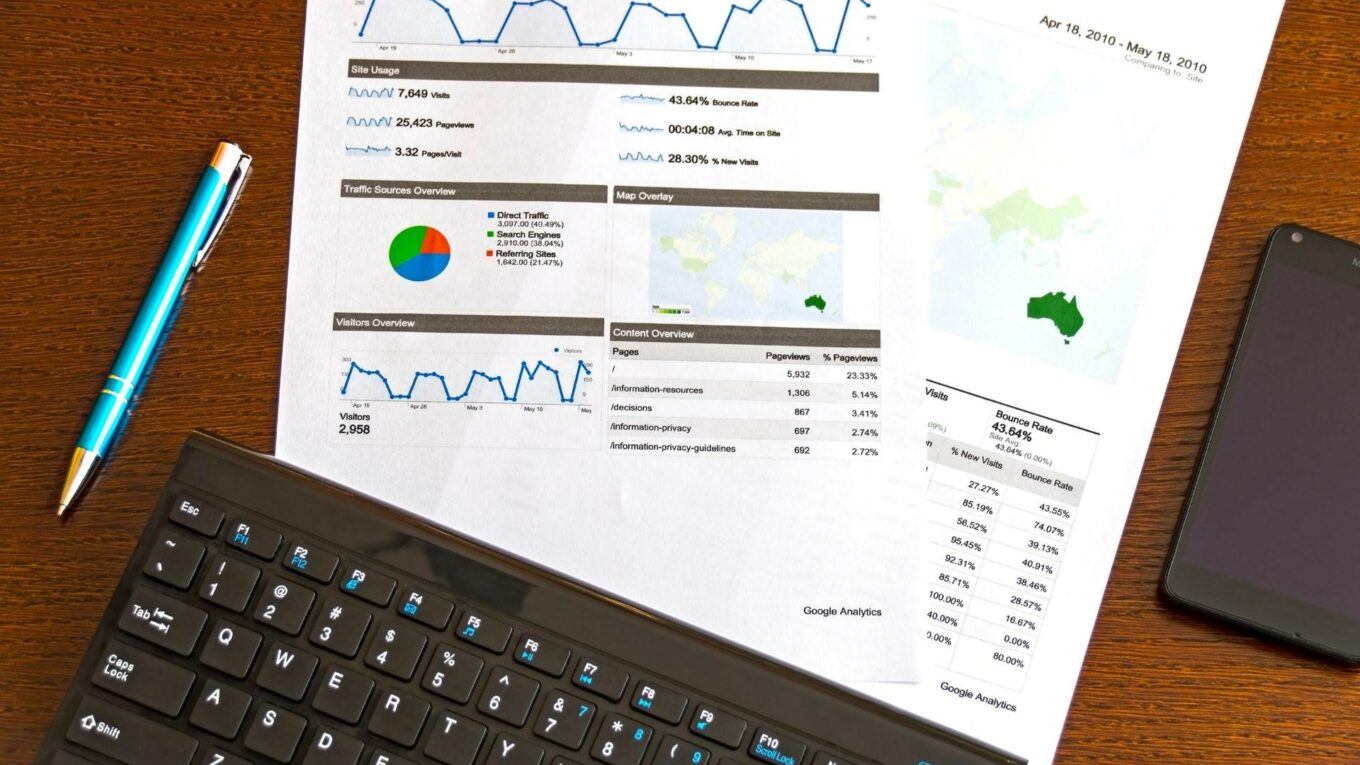
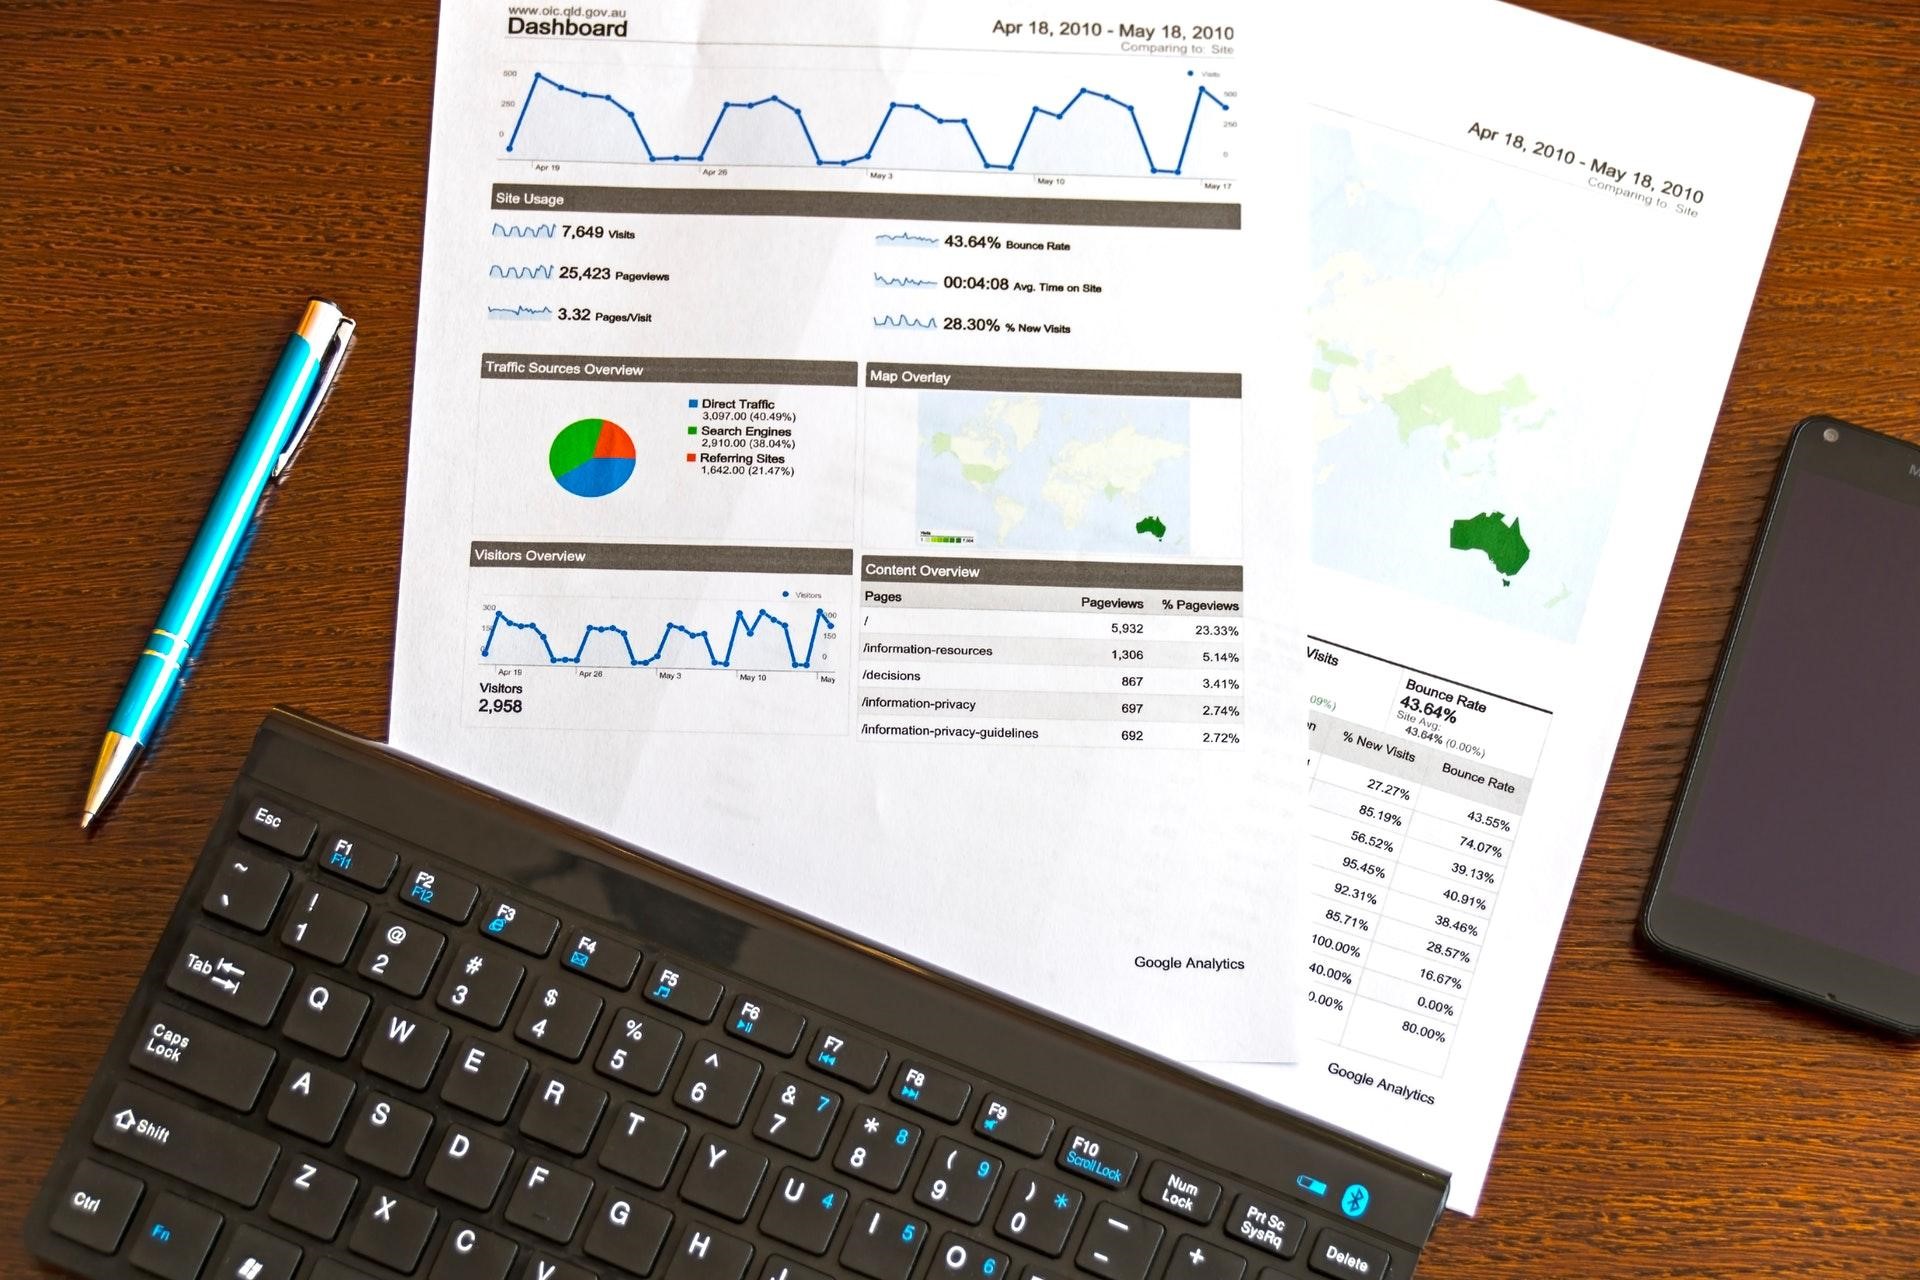
Data visualization is a powerful tool that can help you make sense of complex data sets. By visualizing data, you can identify patterns and trends that would otherwise be hidden. This can give you a competitive edge and help you make better decisions.
Digital marketing is another effective way to reach more customers and grow your business. With digital marketing, you can target specific demographics and deliver personalized messages. This can help you build relationships with customers and leads to increased sales.
Investing in data visualization and digital marketing can help you reach your goals and take your business to the next level. Here Techie Loops presents some of the most effective data visualization and digital marketing techniques that you should consider using.

Use Visualization to Boost Website Traffic
When it comes to data visualization and digital marketing, there are a lot of different techniques that you can use. But which ones are the best? Here is an overview of the most commonly used techniques:
1. Create Infographics
Infographics are a great way to visualize data. They’re easy to understand and they’re visually appealing. People are more likely to remember information if it’s presented in an infographic.
2. Use Charts and Graphs
Charts and graphs are another effective way to visualize data. They can help you see relationships between different data sets.
3. Use Maps
Maps are an effective way to visualize data that’s location-based. They can help you see patterns and trends in data.
4. Use Heatmaps
Heatmaps are a type of visualization that uses color to show how data is distributed. They can be used to show things like density or intensity.
5. Use Scatter Plots
Scatter plots are a type of visualization that shows the relationship between two variables. They can be used to identify trends and patterns in data.
6. Use Bar Charts
Bar charts are a type of visualization that shows data using bars of different lengths. They can be used to compare data sets or to show relationships between different data sets.
7. Use Pie Charts
Pie charts are a type of visualization that shows data using a circle divided into wedges. Each wedge represents a different category. Pie charts are typically used to show proportions or percentages.
8. Use Line Graphs
Line graphs are a type of visualization that shows data over time. They can be used to track trends and patterns in data.
9. Use Word Clouds
Word clouds are a type of visualization that uses words of different sizes to represent the frequency of occurrence of those words. They can be used to identify key topics or themes in data.
10. Use Treemaps
Treemaps are a type of visualization that shows hierarchical data using rectangles. They can be used to show relationships between different data sets.
These are just some of the most effective data visualization and digital marketing techniques that you should consider using. Using these tools can help you to present important information to your employees, investors, or stakeholders. You may find that, when attempting to share or print images, that the file types do not match. You can try a PDF to JPG online converter to ensure that your graphics are transferable between documents, and that you can edit them into other programs.
Use a Banner Template to Boost Website Traffic
A banner template can help you design an effective banner ad that will grab attention and clicks. Here are some tips for using a banner generator tool:
1. Use Contrasting Colors
Contrasting colors will help your banner ad stand out. Use a color scheme that will make your ad pop.
2. Use an Attention-Grabbing Headline
Your headline should be short and to the point. It should grab attention and make people want to click.
3. Use an Effective Call to Action
Your call to action should be clear and concise. It should tell people what you want them to do.
If you want to take your business to the next level, you need to delve into the world of digital marketing. And if you want to make the most of your digital marketing, you need to explore data related to your business. With the help of visualization, you can turn this raw data into important information and insights you can realistically use.
As a business leader, you need to be informed about new ways to use technology, including data representation and marketing. Let Techie Loops keep you “in the loop” about these advancements. Visit us online to learn more.
3 thoughts on “Data Visualization and Digital Marketing Techniques That Will Take Your Business to the Next Level”