What’s New in Kibana 7.12: Kibana Lens is Now Generally Available
With a simple drag-and-drop interface, Kibana Lens makes it simple to display your Elasticsearch data. The lens represents Kibana’s data visualization’s future, and it’s the ideal experience we would like the users to have. After 11 months in beta, it is observed that hundreds and thousands of users have used Lens to explore their data like never before, and with such positive feedback, it is decided that now is the perfect moment to make Kibana Lens available to everyone. Get this Kibana training that helps in making the business decisions for the Elastic SaaS business. You will learn and implement the concepts of kibana which include the basics, content management, data visualization, data modification techniques, filters associated with Kibana, etc.
Various capabilities have been consistently added to Lens since its beta release over a year ago, assisted by fantastic input from thousands of Lens users in our community. With each new release in 2020, Lens has progressed, from new chart formats like donut charts and treemaps to detailed analytics formatting options – and this is only the beginning.
Kibana Lens is now officially approved for production use cases since it has been made available to the general public.
Lens 7.10 comes with a slew of a new platform that gives you even more options for finding and sharing information, including:
- Types of charts based on percentages are now available.
- Filtering aggregations is a useful feature.
- Several new format and setup options have been added.
Drive insights by building dashboards and URL drill-down actions
Whether you’re monitoring for system issues in developer operations or monitoring for real-time cyber threats in a security operations center, dashboards provide insights that drive essential decision-making.
Kibana can assist you in turning these findings into actionable information.
URL drill-downs, a new feature in 7.10, let you bridge the gap between choice and action. Drill downs from the dashboard to dashboard were previously presented as a tool for you to create analytical navigation pathways for viewers between dashboards. In version 7.10, you may now change the destination of the routes to any URL.
You may move from seeing harmful cyber activity in your Kibana online security dashboard to blacklisting an IP in your firewall system with a single click. By navigating to your incident response platform, you may respond to application performance issues noticed in your monitoring views in seconds.
Kibana’s new URL drilldowns offer more than just a navigational aid: Each Kibana visualization may be used to drill down to a URL using query string parameters derived from the data.
While tabbing between views, you may bypass manual procedures like copying and pasting IP addresses or hostnames. URL drill-downs in Kibana may allow you to create tickets with pre-filled fields, feed incident information into description fields automatically, and pre-designate priority levels depending on data already on your dashboard.
URL drill-downs are open in beta as part of a Gold membership or above with Kibana 7.10.
Adding descriptions to the dashboard charts
It is frequently beneficial to give more information on visual analysis to dashboard visitors. What kind of information is being used? So why is a certain strategy chosen? What would be a significant point to ponder or a conclusion to reach?
Chart titles are useful, but they may only convey so much information; you may need additional room to include crucial details and context, especially if your data inquiry is subtle or sophisticated. Panel descriptions are now included in the tooltip for the “i” information icon in Kibana 7.10. When you add a description to a chart, it will now show as a tooltip when you hover your mouse over the “i” in the panel.
Easy file upload with longitude and latitude data using Elastic Maps
It’s important to consider your location. We’re on a mission to make geographic data input, analysis, and action easier than ever before. The File Data Visualizer functionality in 7.10 has been upgraded to identify and integrate latitude and longitude information in file uploads. This technique produces a “geo point” column in the resultant Elasticsearch index automatically, saving you time from manually configuring it during import.
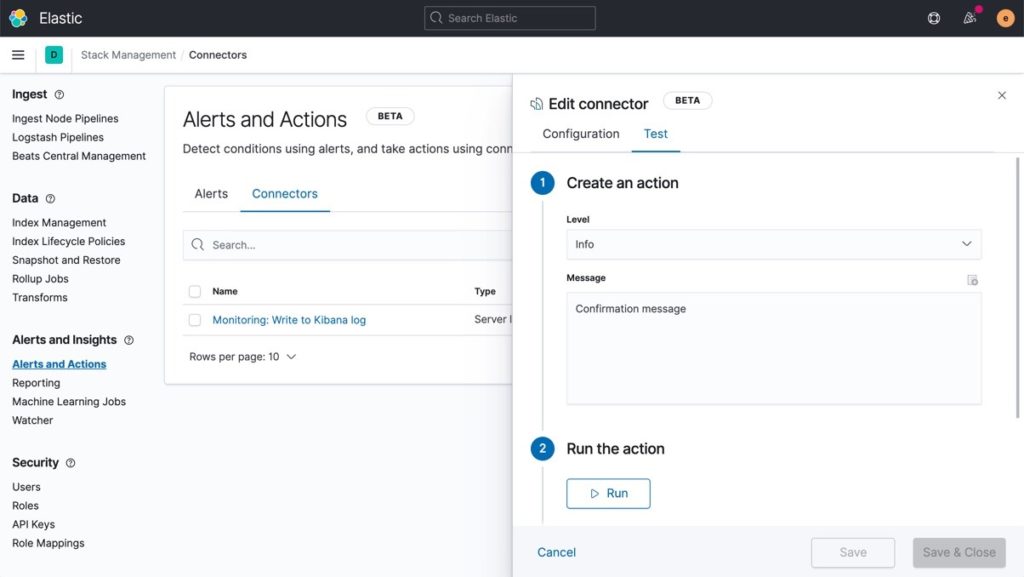
New test option for alert connector
While Kibana’s user interface makes it simple to set up alerts and connect them to actions, It’s still easy to misconfigure it accidentally with them now and then. (For instance, an invalid email address or an improper API key).
To protect against these circumstances, we’ve included the option to test an alerting connector during the initial setup process to ensure it works.
Keeping your Elastic Stack Secure
The stack management application of Kibana provides administrators with an ever-expanding set of tools for managing their stack. Previously, its feature menu offered tools that some users didn’t want or have access to. Stack Management now only displays the features that each user is permitted to use based on the cluster and index capabilities that their role grants them. This not only provides a cleaner overall experience but also allows administrators to use Kibana’s capabilities to quickly set up common use cases like dashboard-only access.
ML features for better anomaly detection
You can now create anomaly detection ML tasks in the revised Metrics app and observe any abnormalities in Metrics’ new Timeline feature. Anomaly increases in memory and network activity on hosts and Kubernetes installations are detected by these tasks. You may create tasks right from the Metrics app, then check the outcomes in machine learning.
Conclusion
In this blog, we have discussed the important features that were implemented in the latest Kibana 7.12. This overview provides you only a brief summary of Kibana Lens features. To explore more on Kibana get the required training essentials that will aid you in developing your career prospects.


One thought on “What’s New in Kibana 7.12: Kibana Lens is Now Generally Available”